|
-- Colin Donihue, PhD Candidate One of my dissertation chapters was recently published in Functional Ecology and they asked me to make a video explaining the research. Here it is, Enjoy!
1539 Comments
-- Rob Buchkowski PhD Student This was the first summer of my PhD, and it spent a lot of time exploring some of the animals that make up the detritus-based food chain in our old-fields at Yale-Myers forest. The detritus-based food chain includes all the animals that can trace their food back to decaying material like plant and animal litter. Some common examples of species include earthworms, crickets, millipedes, and woodlice. One of the most common species is Trachelipus rathkii, which is a species of isopod or woodlouse. Isopods are actually crustaceans, but are able to survive on land because they have adapted morphologically and behaviorally to conserve water. You can identify T. rathkii from the other species in New England quite easily, because it has 5 pairs of lungs on the underside that are quite easy to see. These lungs are used to breath, but area totally different from human lungs. Other isopod species in New England have 2 visible pairs. 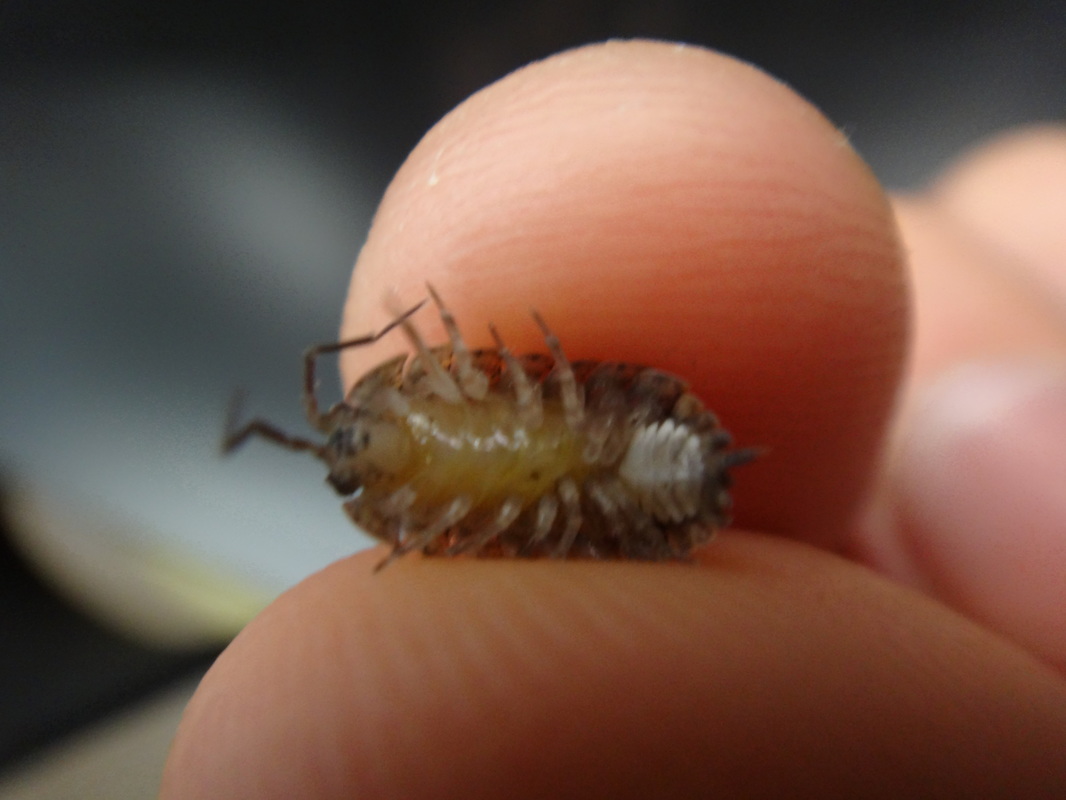 I also spent some time looking for another group of detritivores—earthworms! We all know that earthworms are really important in promoting soil nutrient cycling, but I am interested in how there impact on soils might influence plant and animal communities aboveground. I started off this summer by trying to figure out how many earthworms live in our old-fields. To do this, I searched through about 230,000 cm3 of soil to get a reliable estimate of population size. I found that our fields vary from having 125 – 275 m2. This is a lot of earthworms, but not unexpectedly high. This fall, I am hoping to identify the species of earthworms, and work on some more efficient methods for extracting them. 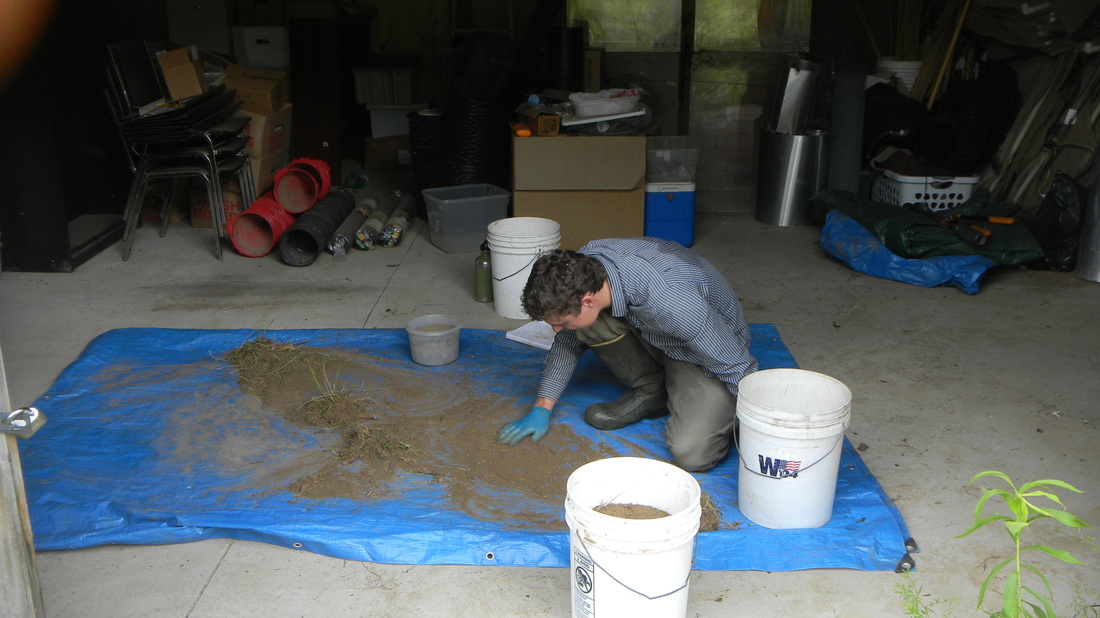 Finally, I spent some time looking at the predators of these detritus eating species. One common predator is wolf spiders. Wolf spiders eat crickets, isopods, and a number of other soil animals. They also eat insects that feed on plants. Check out this video of a wolf spider eating an isopod! -- Jennie Miller, PhD ‘15 One of the biggest challenges for a wild carnivore today is avoiding conflict with humans. With livestock now using 30% of ice-free land on our planet, most carnivores likely live within or adjacent to a buffet of domestic animals, served up fear-free, tender and ready for the taking. But this livestock buffet has hidden costs when owners use lethal control or poison carcasses to kill carnivores and reduce future livestock losses. Livestock owners and wildlife managers have struggled for centuries to protect domestic animals and carnivores alike by implementing a variety of nonlethal tools to reduce attacks, but knowing when and where to focus tools is tricky. Last week Biodiversity and Conservation published my review on an emerging method for mapping livestock depredation hotspots, which aims to strengthen efforts to reduce human-carnivore conflict. The article describes spatial risk models how they have been used by conservationists in outreach with livestock owners, managers and policymakers. For instance, in rural Tanzania, the Ruaha Carnivore Project shared risk maps with livestock owners through PowerPoint presentations conveyed in Swahili and delivered during educational movie nights to help people recognize distributions of predator risk in their area. In Gujarat, India, risk maps on Asiatic lion attacks on livestock were included in conflict management manuals distributed to high-risk villages. In Hunchun, China, hotspot maps were included in a policy document that reportedly contributed to the government agency increasing efforts to resolve human–tiger conflict. In other words, maps are an ideal tool for communicating information with non-scientist audiences. And with increasing access to the internet and smartphone technology across the world, risk maps can be shared with stakeholders in innovative ways. A great example is the interactive online map of wolf risk to livestock in Wisconsin, created by the Carnivore Coexistence Lab at the University of Madison-Wisconsin, where ranchers can type in their address and view to risk over several years around their property. Below are a few samples of the variety of visual forms that risk maps can take.  A sample of livestock depredation risk hotspot maps for (a) grizzly bears in Montana, (b) lions in Gujarat, India, (c) tigers in India and (d) pumas in Argentina. Figure from Miller 2015. Especially if information already exists on the when and where of livestock kills, models can be relatively simple and inexpensive to integrate into the conservation decision-making process. In areas where financial compensation programs already exist, management agencies or non-profit organizations often have large databases of livestock depredation cases that can be used to model carnivore risk to livestock. The process of building and applying risk maps can roughly follow the steps outlined below: 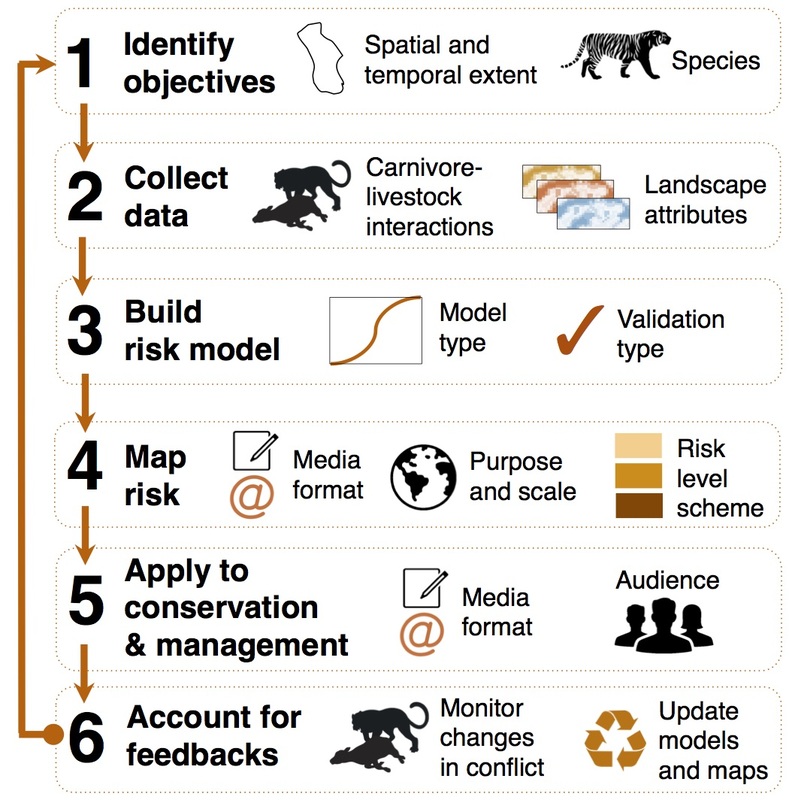 Steps for creating and applying predation risk maps to mitigate human–carnivore conflict. Figure from Miller 2015. My PhD involved developing spatial risk models for tigers and leopards on livestock in Kanha Tiger Reserve, central India. I saw first-hand how intuitively managers could understand risk maps and how maps could help inform management actions (e.g. fencing out livestock in high-risk areas).
Based on my experience of how easy and inexpensive risk models and hotspot maps are to build and use, I encourage researchers and managers to explore the many applications of these maps for their work. In particular, future efforts should focus on: · Building and validating robust models across more areas of the world where carnivore attacks on livestock cause major problems for local livelihoods and carnivore conservation. · Integrating risk models into long-term management and monitoring to explore whether they can effectively reduce human-carnivore conflict. · Developing new and innovative methods for displaying, sharing and applying results from risk models to reach new audiences (e.g. citizen science and smartphone apps). · Greater outreach with policymakers so that risk maps can inform large-scale decisions on conflict. · Investigating ecological and behavioral feedbacks that may occur after livestock grazing or patterns protection efforts change (would make a fantastic PhD project!). Spatial risk models and hotspot maps offer a simple, quantitative and insightful tool for the conservation toolkit. With greater and more widespread usage, risk models and maps will continue to improve the effectiveness of mitigation efforts for reducing livelihood losses and strengthening carnivore conservation worldwide. For more information, read the article: Miller JRB. 2015. Mapping attack hotspots to mitigate human-carnivore conflict: approaches and applications of spatial predation risk modeling. Biodiversity and Conservation (early online). PDF available here. |
Archives
November 2019
Categories
All
|
 RSS Feed
